For developers, sysadmins, and power users
The Activity Monitor alternative built for deep inspection.
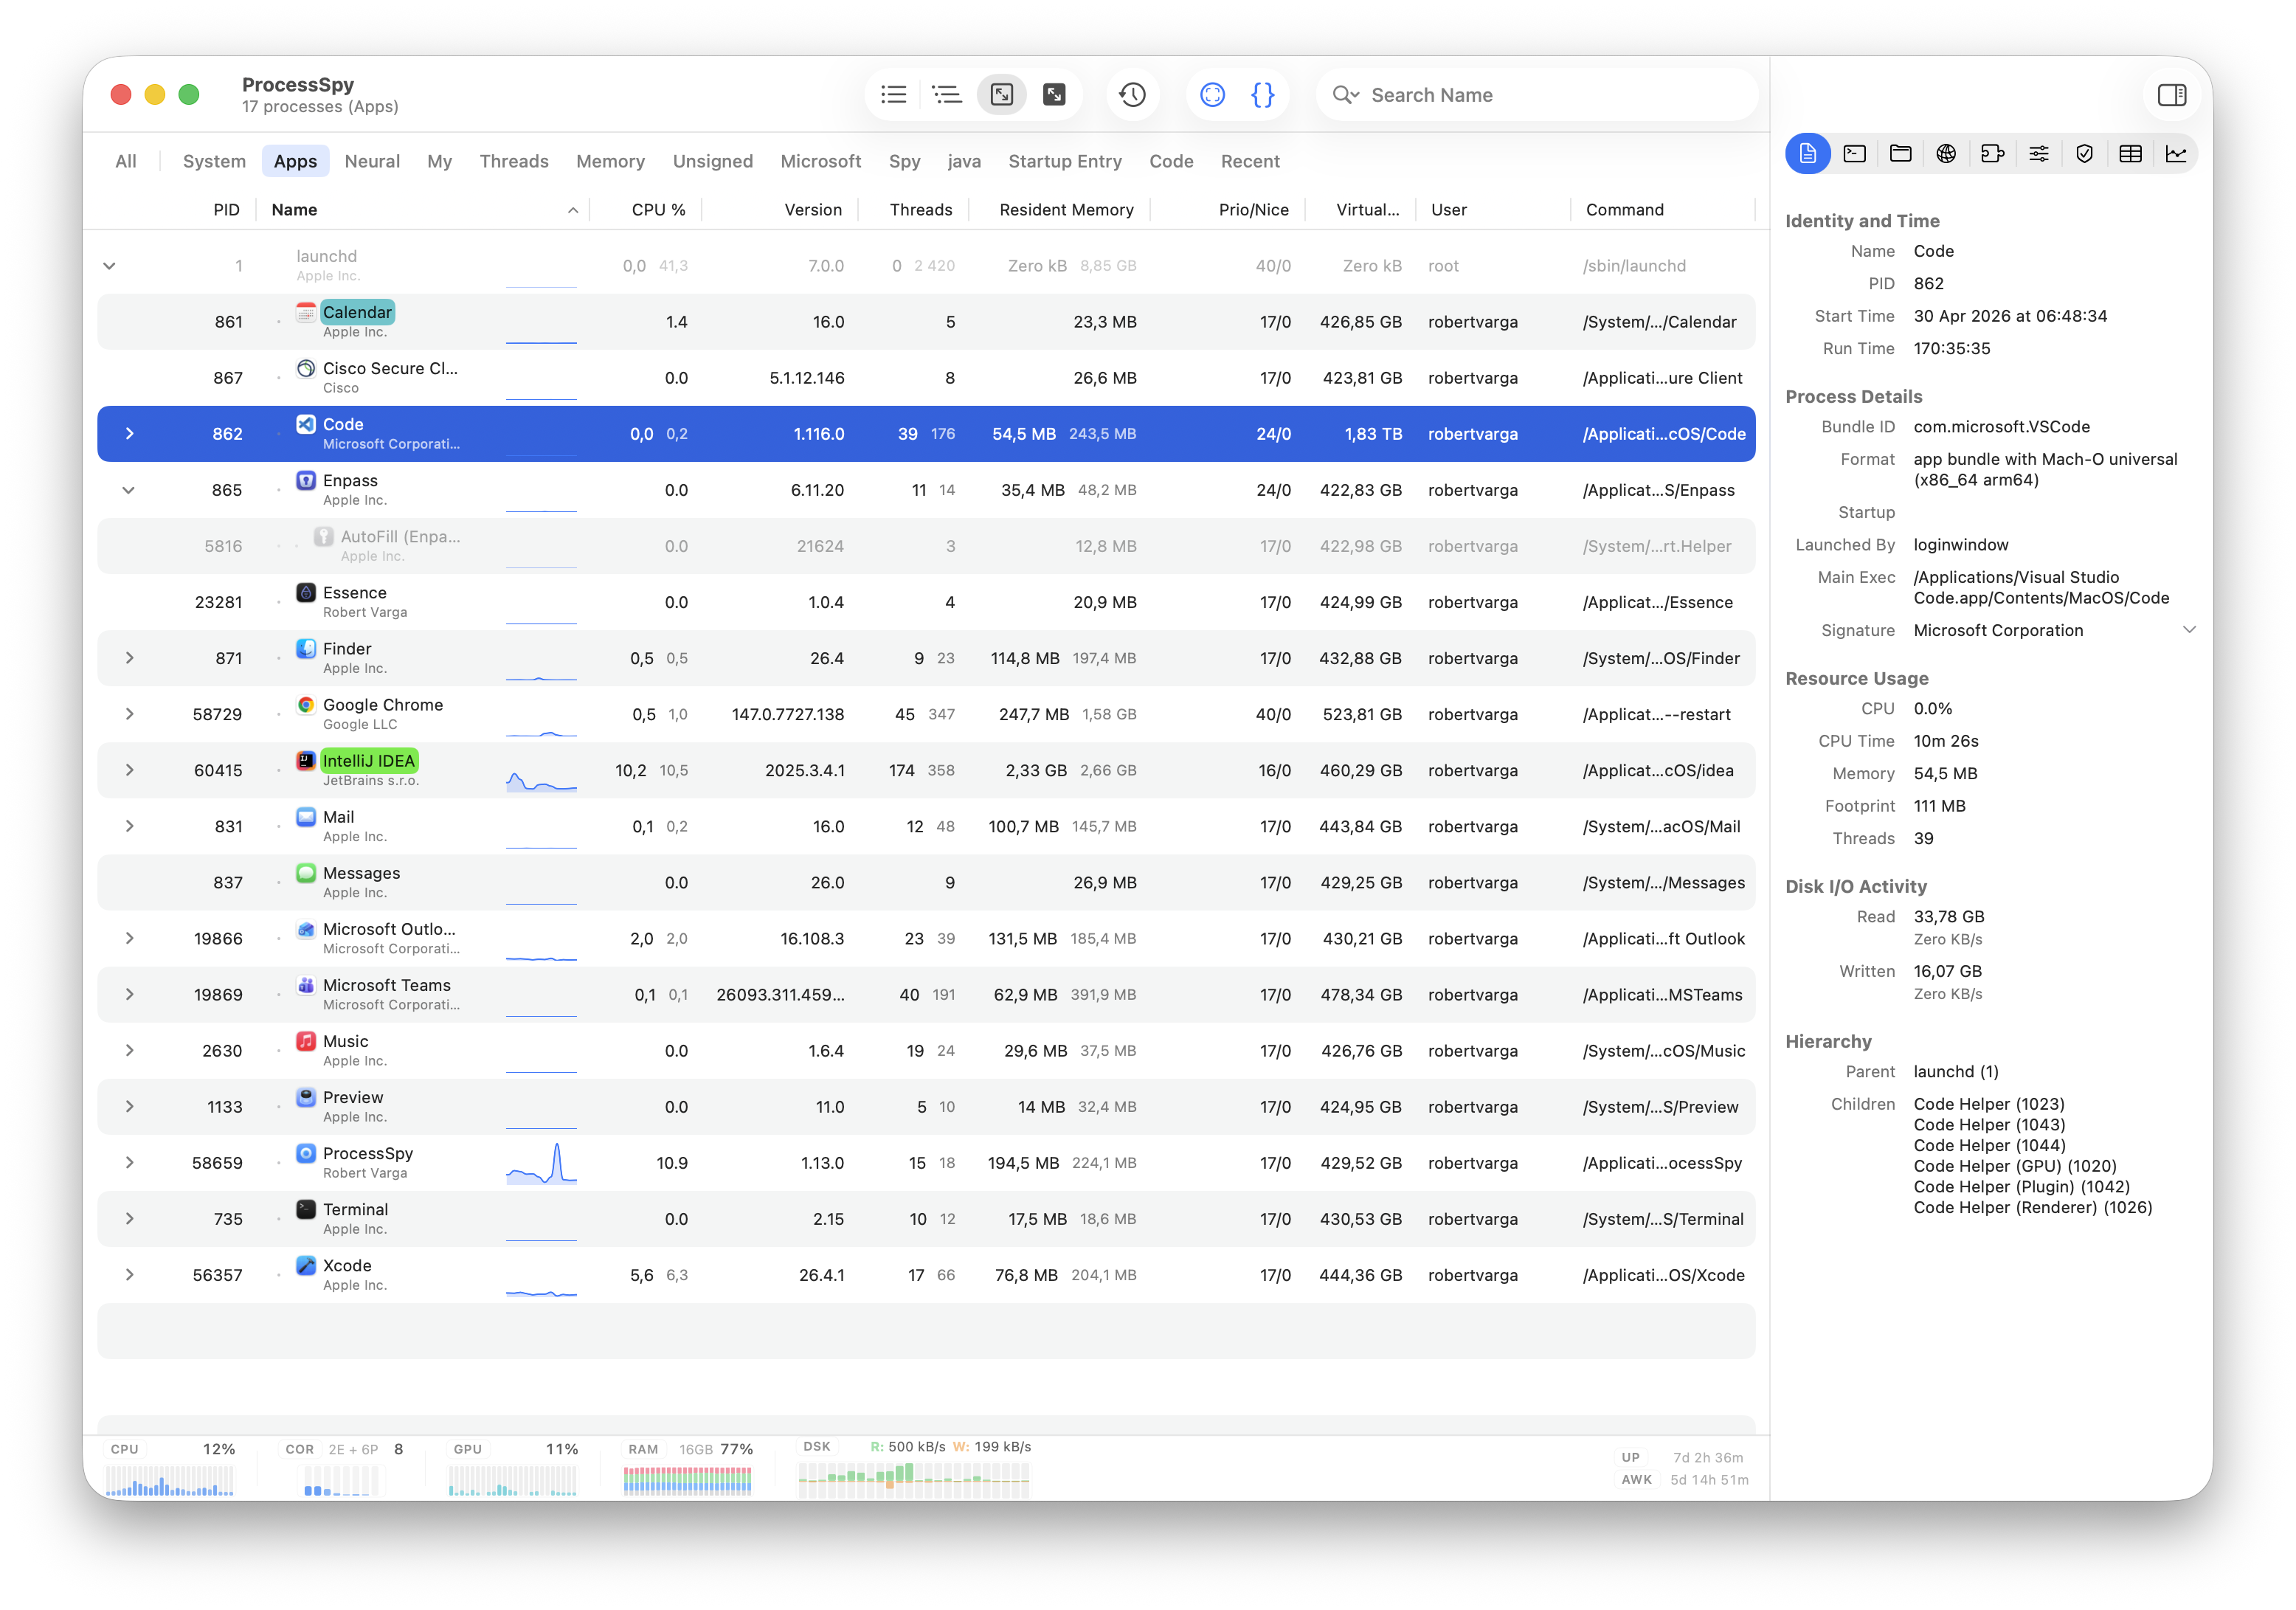
Activity Monitor is fine for a quick look at CPU and memory. When you need the real story — the full command a process was launched with, its environment variables, open files, individual network connections, code signature, and a history that survives after the process exits — ProcessSpy is the native macOS tool built for that.
Why Activity Monitor isn't always enough
Activity Monitor answers "what's using my CPU?" well. It stops short on the questions developers and sysadmins actually ask next: which exact arguments started this process? what environment is it running in? what is it connected to? and what was that process that vanished a second ago? For a deeper look at the gaps, see 10 things Activity Monitor doesn't show.
ProcessSpy vs. Activity Monitor
Activity Monitor ships free with macOS and covers the basics well. ProcessSpy is the upgrade for serious debugging — adding launch details, environment variables, per-connection networking, signing and entitlement data, and a process history you can scroll back through.
| Feature | Activity Monitor | ProcessSpy |
|---|---|---|
| Free & built into macOS | Yes — pre-installed on every Mac at no cost. | No — a freemium, focused utility for power users. |
| CPU & memory at a glance | Yes — clear CPU, Memory, Energy, Disk, and Network tabs. | Yes — live CPU and memory alongside deep per-process detail. |
| Energy & disk impact | Yes — dedicated Energy and Disk tabs, a real strength. | Partial — focused on inspection rather than energy scoring. |
| Process tree / hierarchy | Limited — a "View as Hierarchy" toggle without aggregate totals. | Yes — advanced tree view with parent/child relationships and aggregate totals. |
| Search | Basic — filter the list by process name. | Yes — quick search, multi-property search, and regex search. |
| Identify a window's process | No. | Yes — point-and-click process identification anywhere on the screen. |
| Full command line | No — shows the process name, not its launch arguments. | Yes — full command used to start the process, including arguments. |
| Environment variables | No. | Yes — dedicated Env Vars section with searchable KEY=VALUE entries. |
| Loaded libraries | No dedicated view. | Yes — dedicated Dylibs section for loaded dynamic libraries. |
| Open files | Yes — "Open Files and Ports" in the process inspector. | Yes — Files section lists open vnode-backed file descriptors with paths. |
| Network connections | Limited — Network tab shows totals and throughput per process, not per-connection detail. | Yes — Connections section shows local/remote address, protocol, and state. |
| Digital signature details | No. | Yes — signature details and signing organization shown in the inspector. |
| macOS bundle metadata | No. | Yes — bundle ID, executable details, Info.plist, and entitlements. |
| Historical resource tracking | Limited — live graphs only, over a short rolling window. | Yes — historical CPU, Resident Memory, and Virtual Memory when recording is enabled. |
| Remember finished processes | No — once a process exits, it's gone from the list. | Yes — keeps finished processes available for later inspection. |
| Menu bar popover | No — Dock icon CPU graphs only. | Yes — menu bar popover with rich content available. |
Feature descriptions are based on publicly documented capabilities of Apple's Activity Monitor and ProcessSpy documentation. Some ProcessSpy features are license-only.
Apple, macOS, and Activity Monitor are trademarks of Apple Inc. All other product names, logos, and brands are property of their respective owners. ProcessSpy is an independent product and is not affiliated with or endorsed by Apple Inc.
Get ProcessSpy for Mac
Go beyond CPU and memory: identify mystery windows, read full launch arguments and environment, follow live connections, and scroll back through process history.