
10 Things Activity Monitor Doesn't Show (But ProcessSpy Does)
Activity Monitor is great for quick glances. ProcessSpy goes deeper — with full command-lines, bundle IDs, publisher identity, rich CPU history, and exportable, aggregate views that let you investigate and automate.
- Full command‑line & executable path
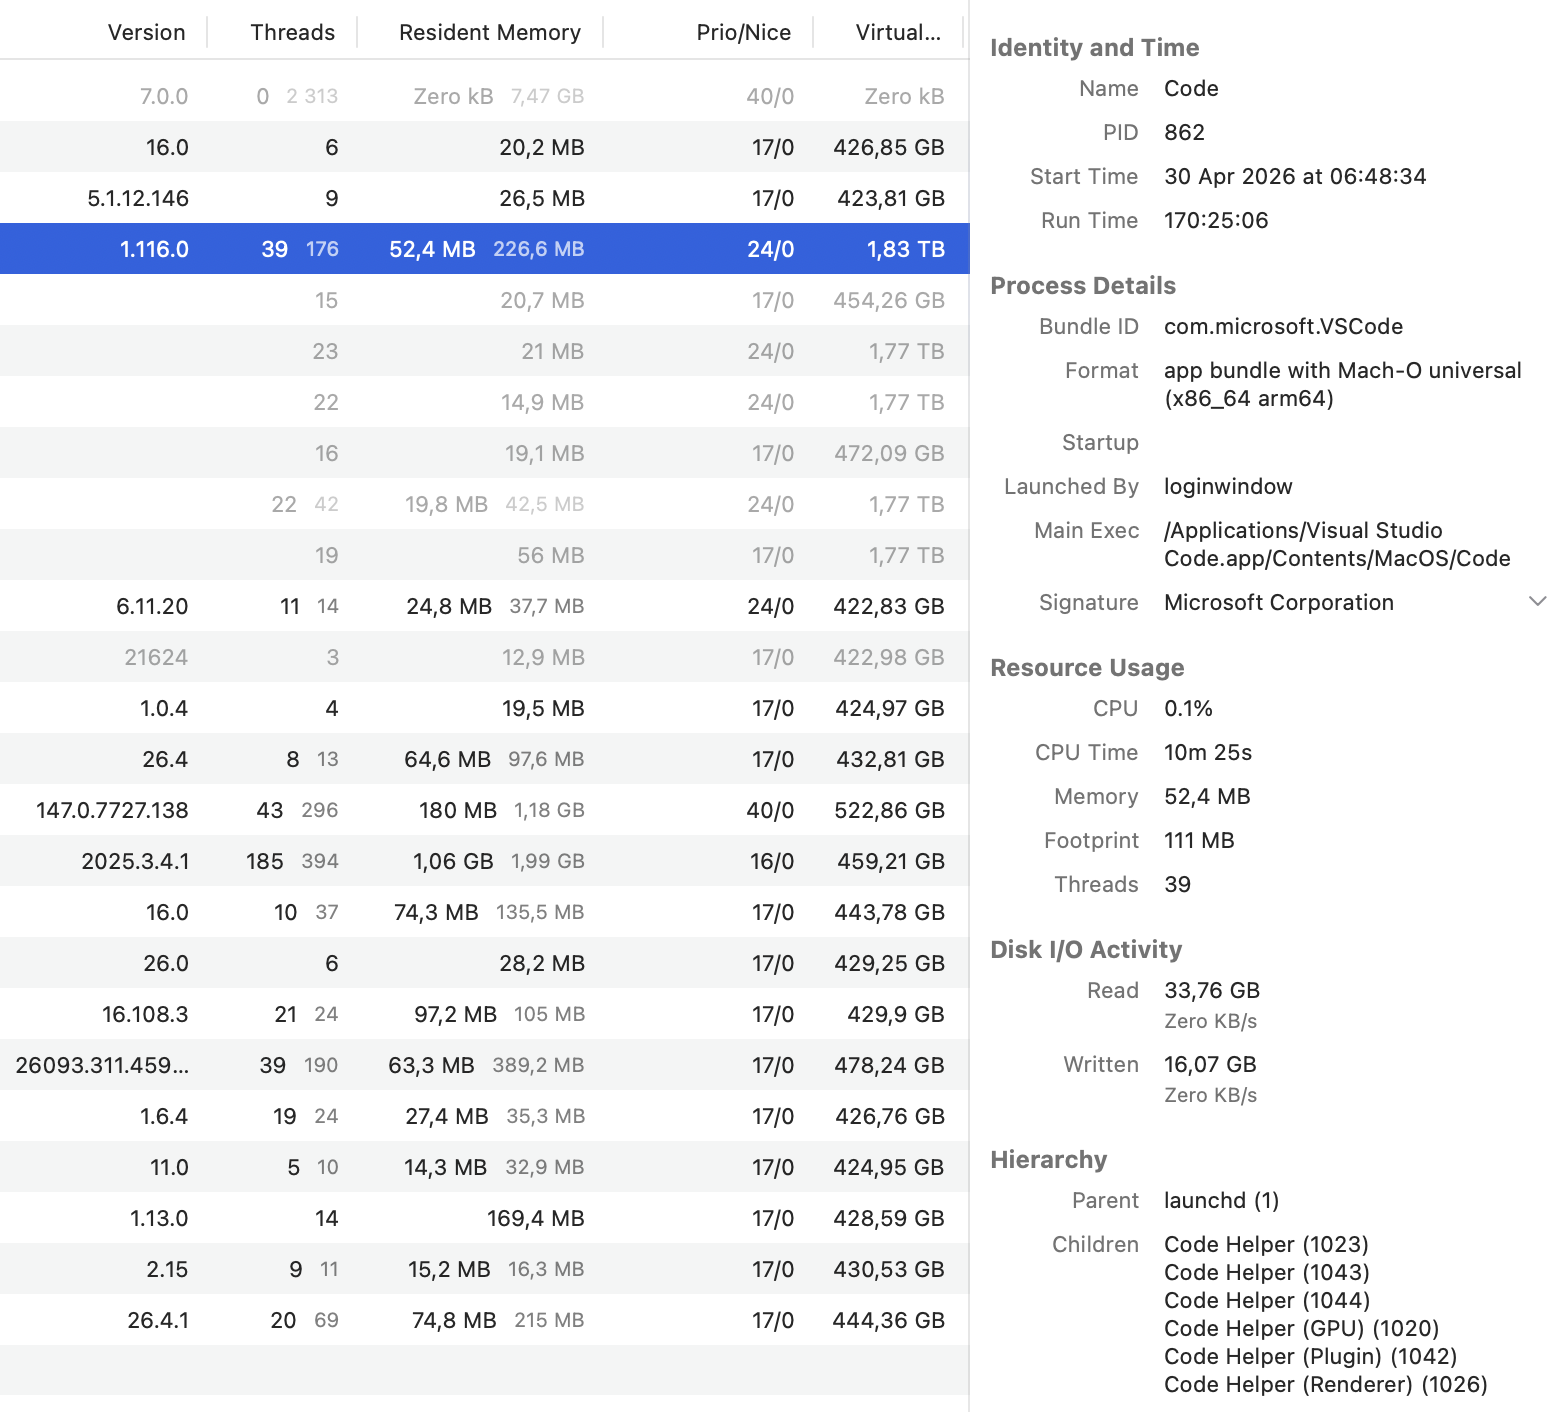
- Bundle ID, App Version, and Publisher
- Open files & sockets + loaded libraries
- Per‑process CPU & memory history
- Aggregate values by app/bundle/user
CPU History
Scroll back in time for each process. Spot spikes, leaks, or recurring tasks. Export the series to CSV for audits.
Identity at a Glance
Version, Bundle ID, and signed Publisher (paid) — verify provenance instantly.
Aggregate Values
See combined CPU/Memory including all child processes. Understand total impact, not just single PIDs.
10 Things Activity Monitor Doesn't Show
-
1) Full Command‑Line Arguments
See exactly how a process was launched — every flag, path, and environment hint. No more mystery helpers.
-
2) Executable Path
Reveal the precise on‑disk binary location to catch odd install locations and troubleshoot launch problems.
-
3) Environment Variables
View the environment provided to the process at launch: paths, locales, feature flags, and injected variables. Reproduce bugs, confirm Rosetta or sandbox contexts, and catch unexpected overrides. Handy for developers, IT, and automation diagnostics.
-
4) Info.plist
Ideal for QA, packaging, and policy compliance checks.
-
5) Launch Origin
Know if it came from a LaunchAgent/Daemon, login item, or manual launch. Trace parent/child chains.
-
6) CPU History & Memory Trends
Historical charts per process help catch periodic spikes, leaks, and post‑sleep misbehavior. Export to CSV.
-
7) Version & Build Info
Confirm the exact app version that's running — ideal for QA, regression hunts, and enterprise rollouts.
-
8) Bundle ID
Disambiguate clones and helper tools by their canonical identifier. Filter or aggregate by bundle.
-
9) Publisher (Code‑Signing)
Verify the signing organization at a glance (licensed). Trust but verify when processes look suspicious.
-
10) Aggregate Values
Group related PIDs into one story: total CPU of all Chrome helpers, memory used by a bundle (via filter), or per‑user totals on a shared Mac.
Go Beyond Activity Monitor
Investigate deeply, verify provenance, and measure real impact with ProcessSpy.