Monitor macOS Processes Like a Pro.
In-depth monitoring with advanced features:
- Per-process CPU & memory history
- Finished process recall — nothing disappears
- CPU QoS breakdown & memory footprint
- Real-time disk I/O & memory pressure rates
- Point-and-click process discovery
- JavaScript filters & regex search
- Aggregate totals in hierarchy view
- Menu bar dashboard
"All the information in one clear and intuitive interface — brilliant work, thank you very much!"
"I was looking for an equivalent to SysInternals ProcessExplorer for Windows. This is it — it has all the features. I love me a native macOS app!"
Designed for macOS
ProcessSpy uses native APIs and UI elements to deliver a fast, responsive, and Mac-first experience. No bloated cross-platform layers — just smooth performance and tight system integration.
ProcessSpy supports macOS 26 Tahoe.
More Powerful Features
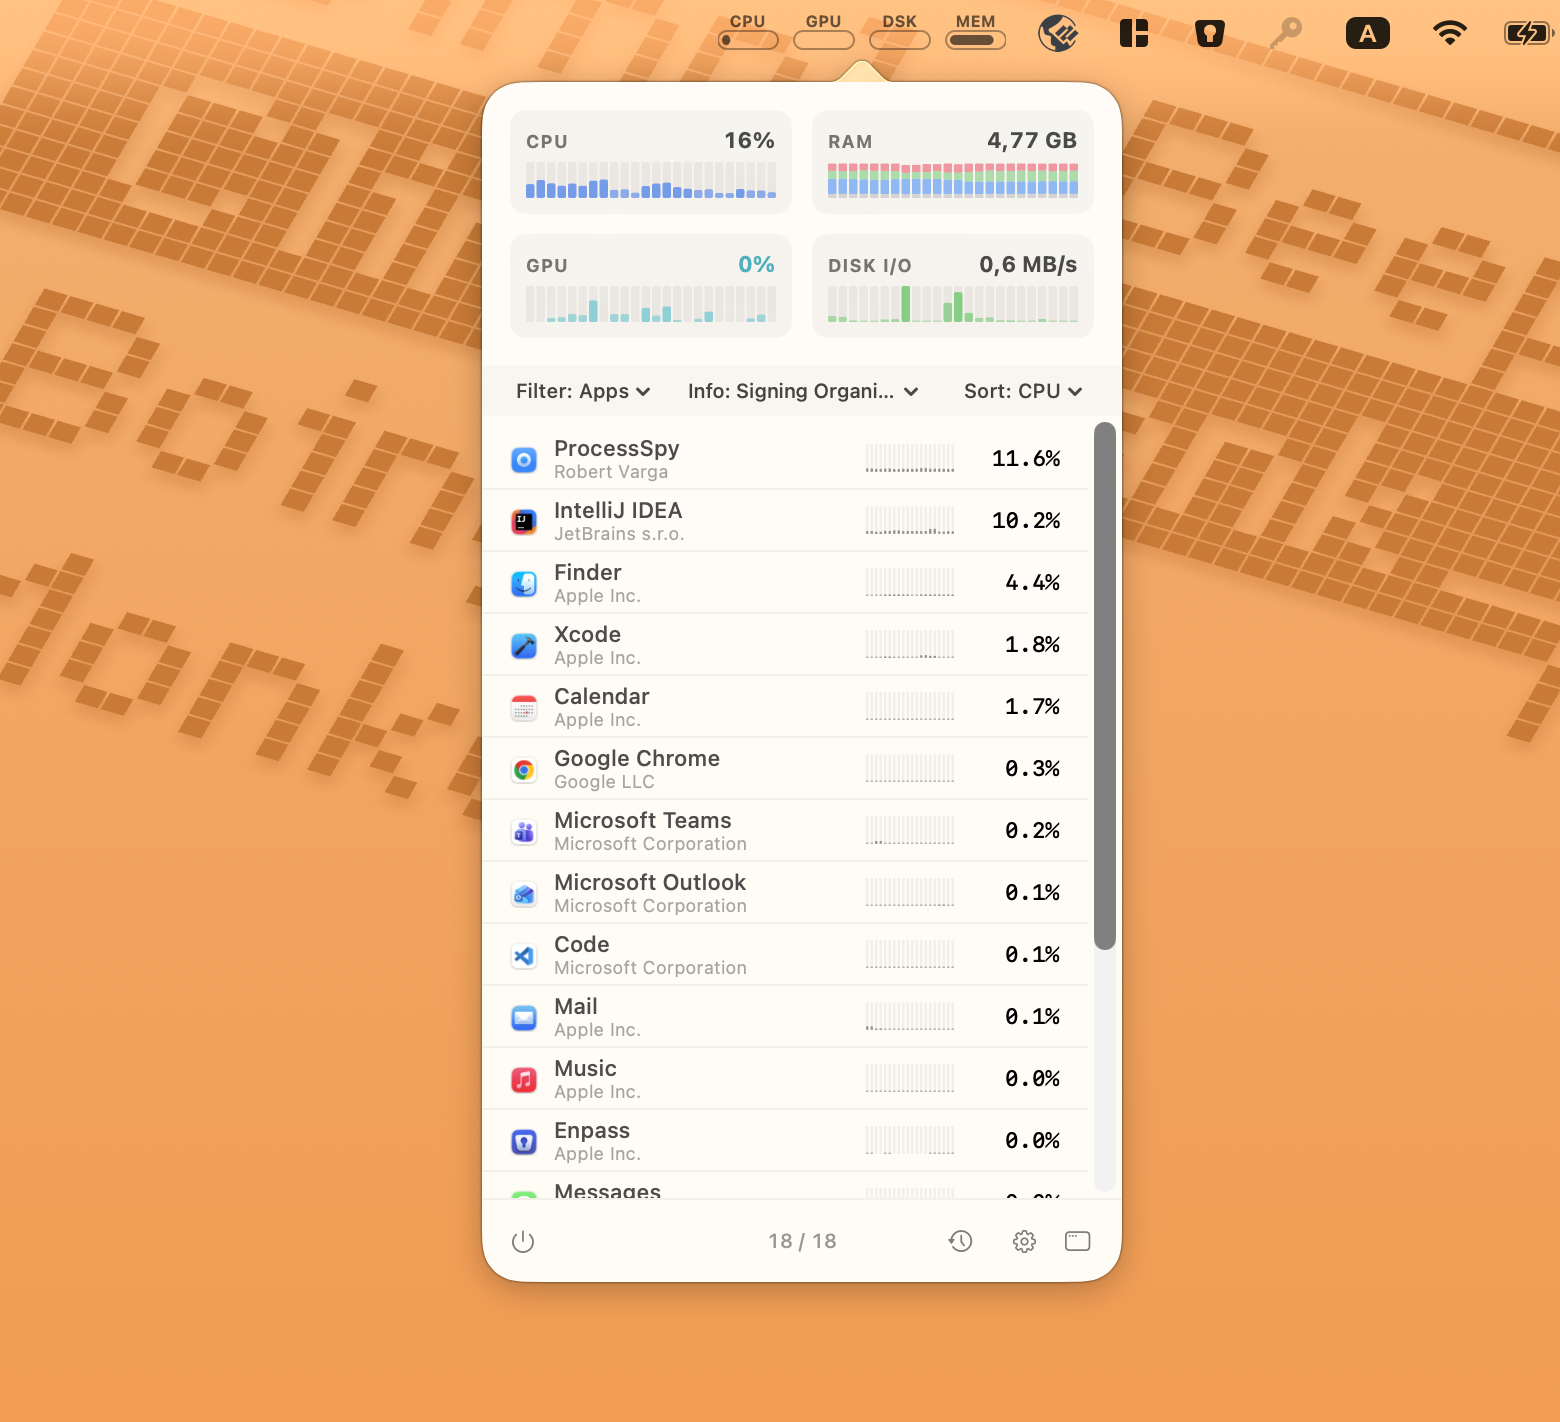
Powerful Monitoring, Zero Interruption
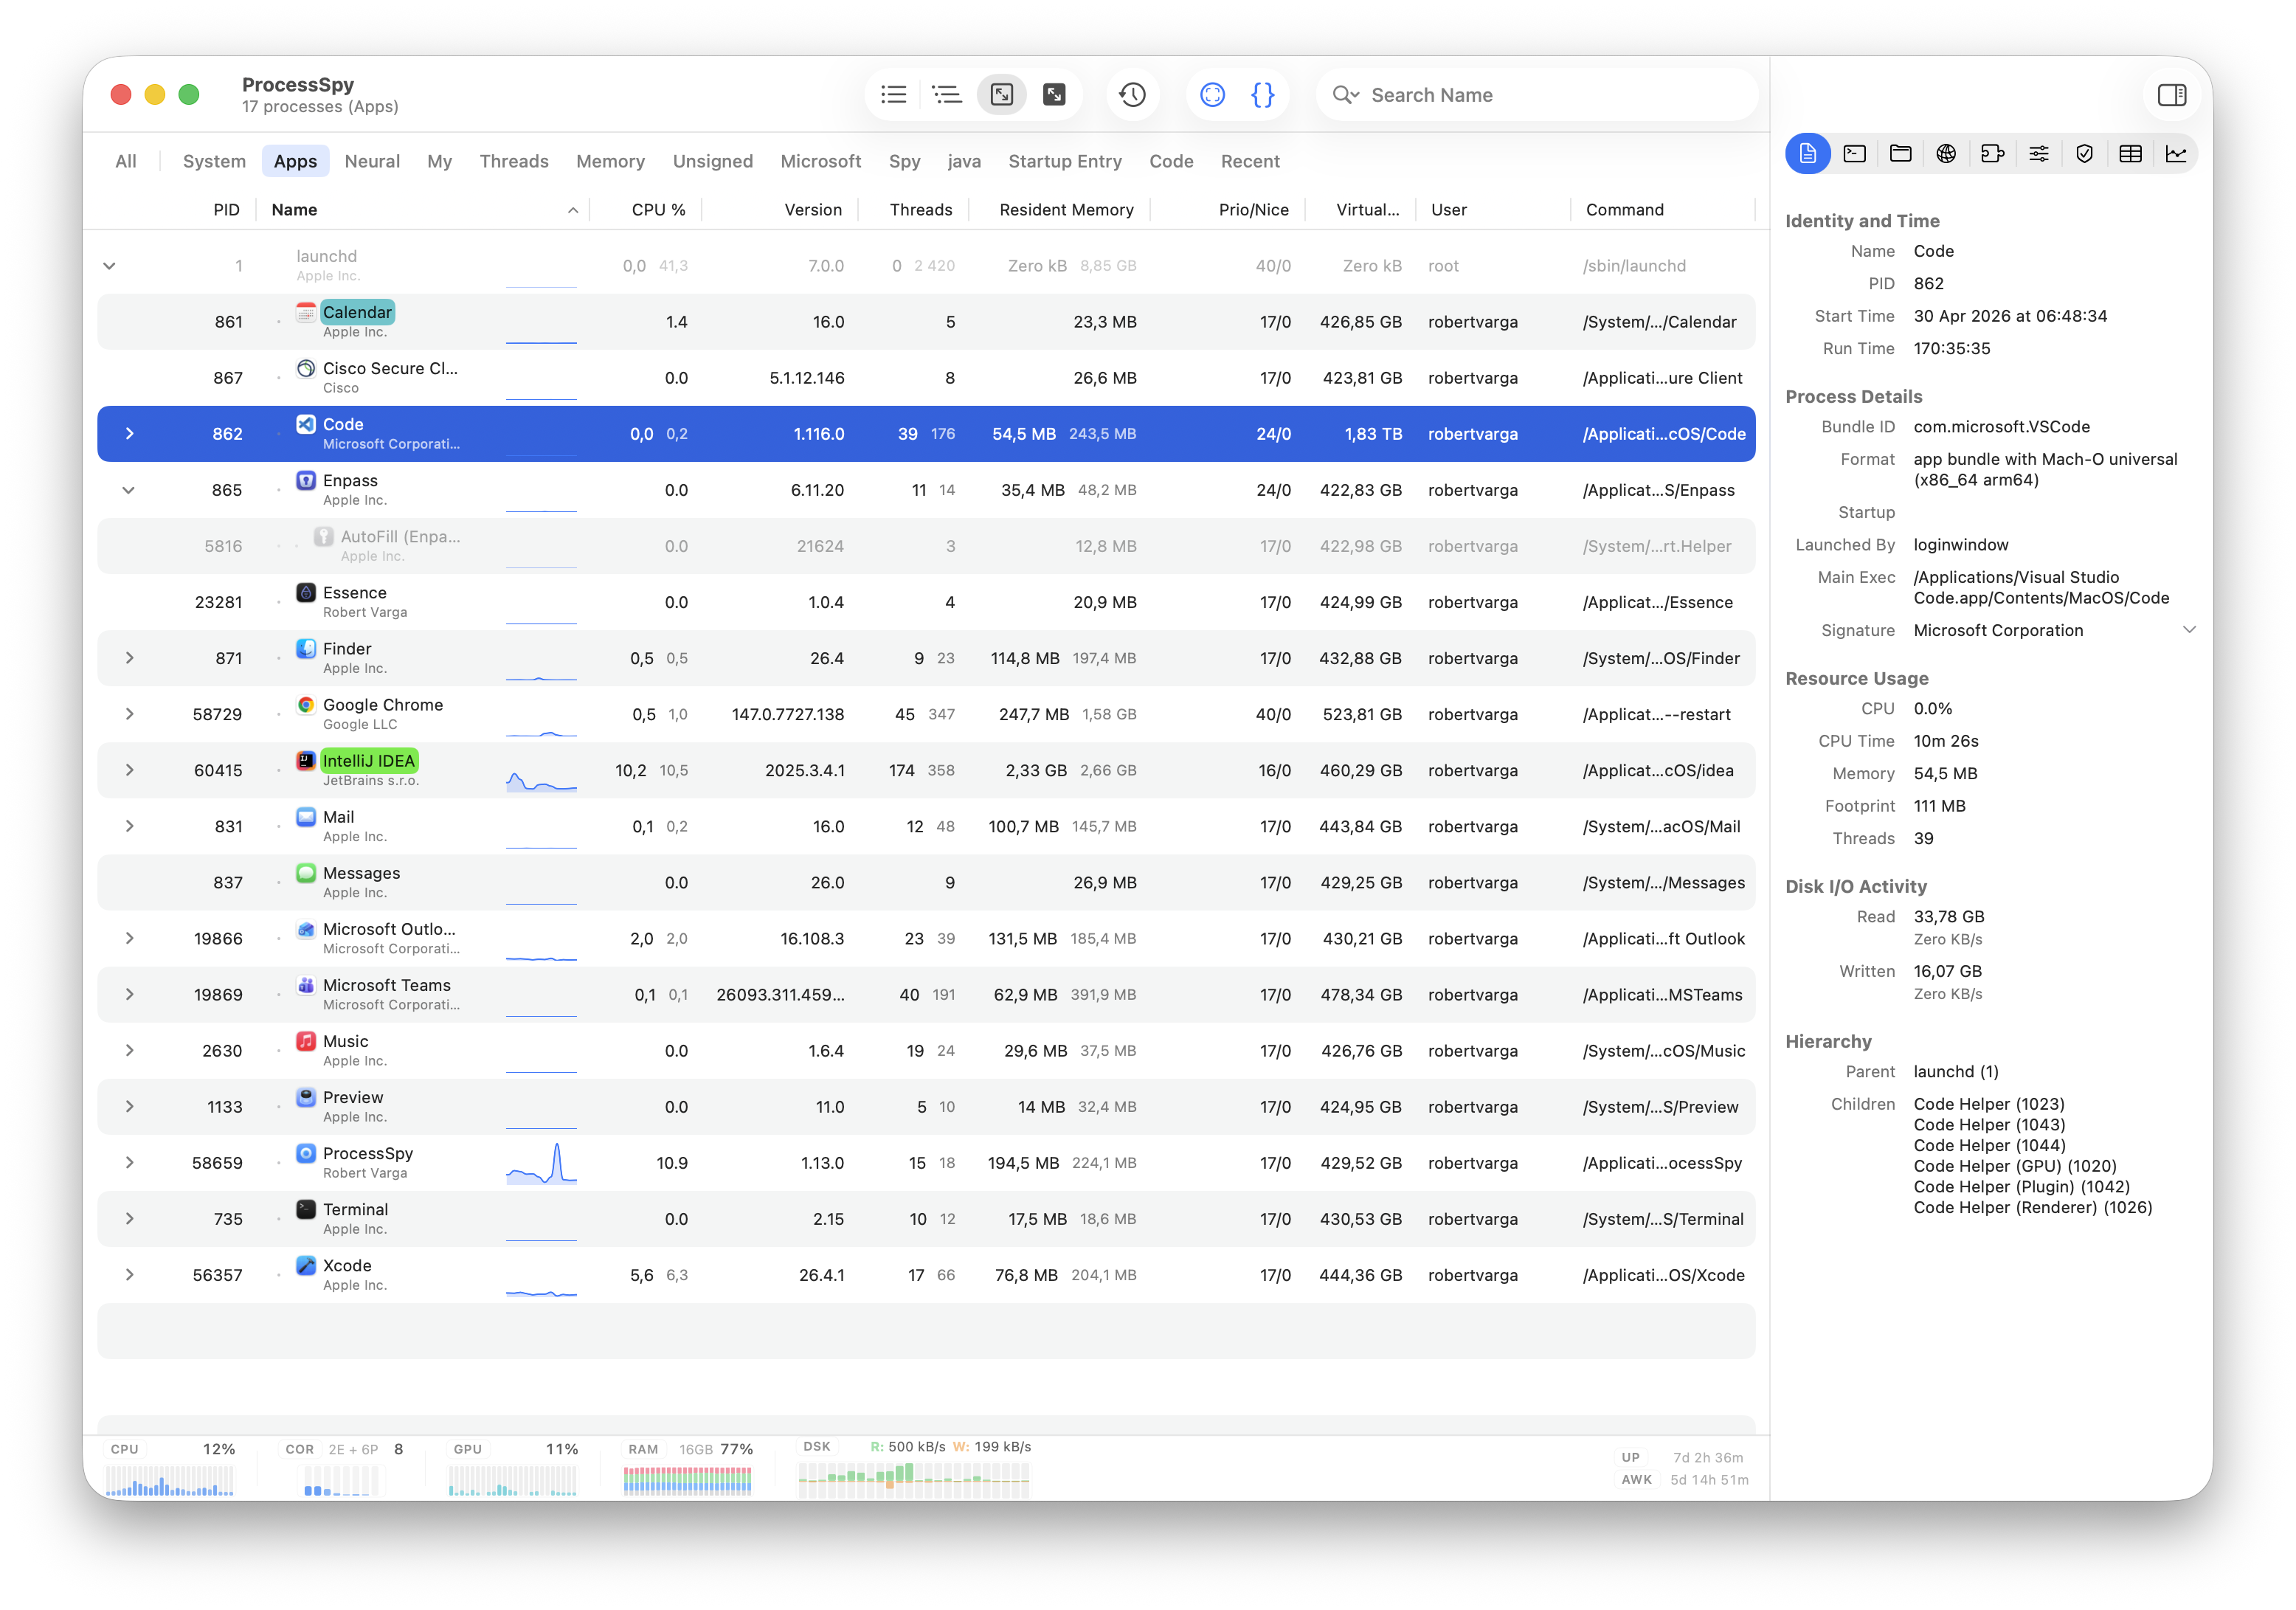
Get the full ProcessSpy experience without leaving your workflow. The menu bar dashboard delivers real-time system health tracking and advanced management tools in a compact drop-down. Enjoy main-window features on the fly, including powerful JavaScript filters and secondary process details—like developer signatures—displayed right beneath the app name for instant identification.
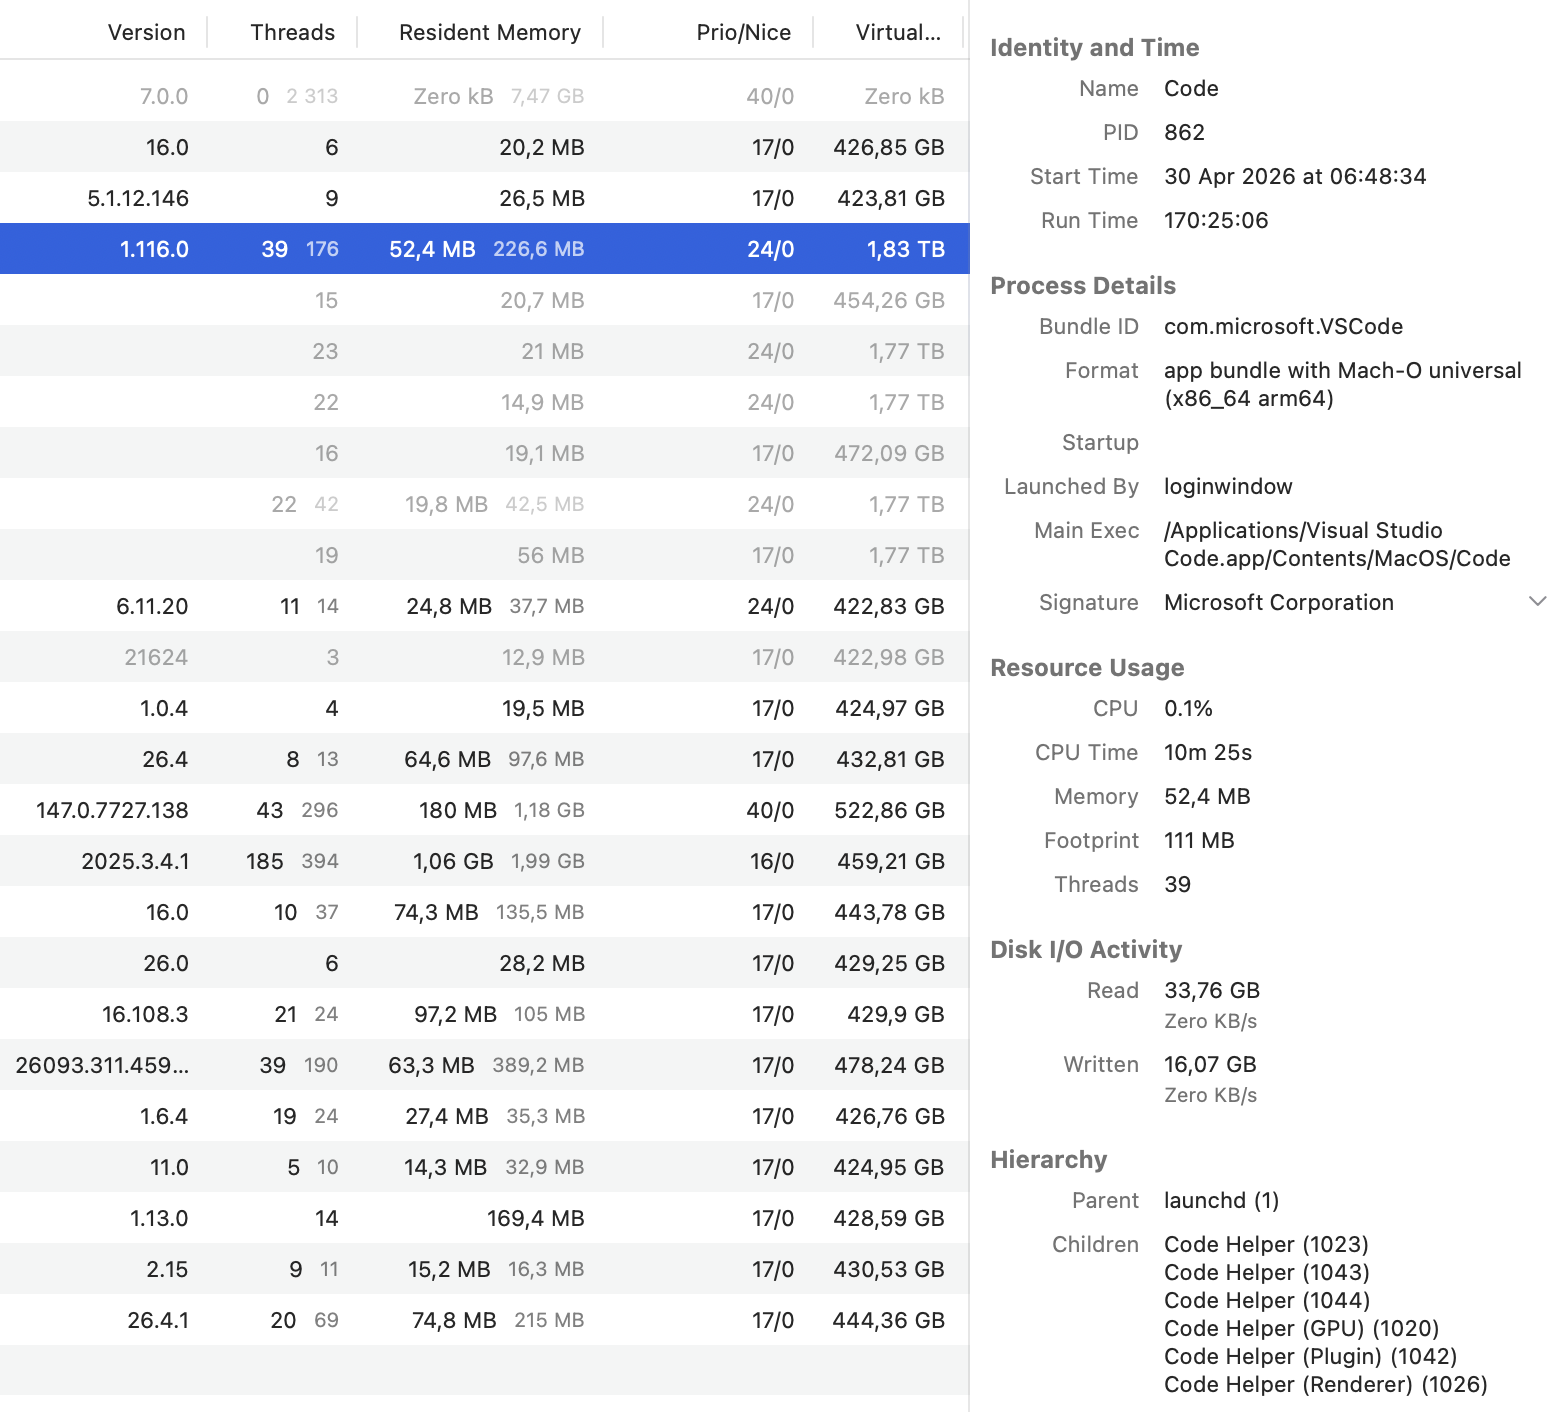
Uncover Every Detail with the Inspector Pane
Stop guessing what your apps are doing under the hood. Our detailed inspection view reveals exactly how an application interacts with your system. Instantly verify if an app is running natively, check its digital signature, track its precise memory footprint, and monitor disk read/write speeds. It's the ultimate troubleshooting companion for developers and power users.
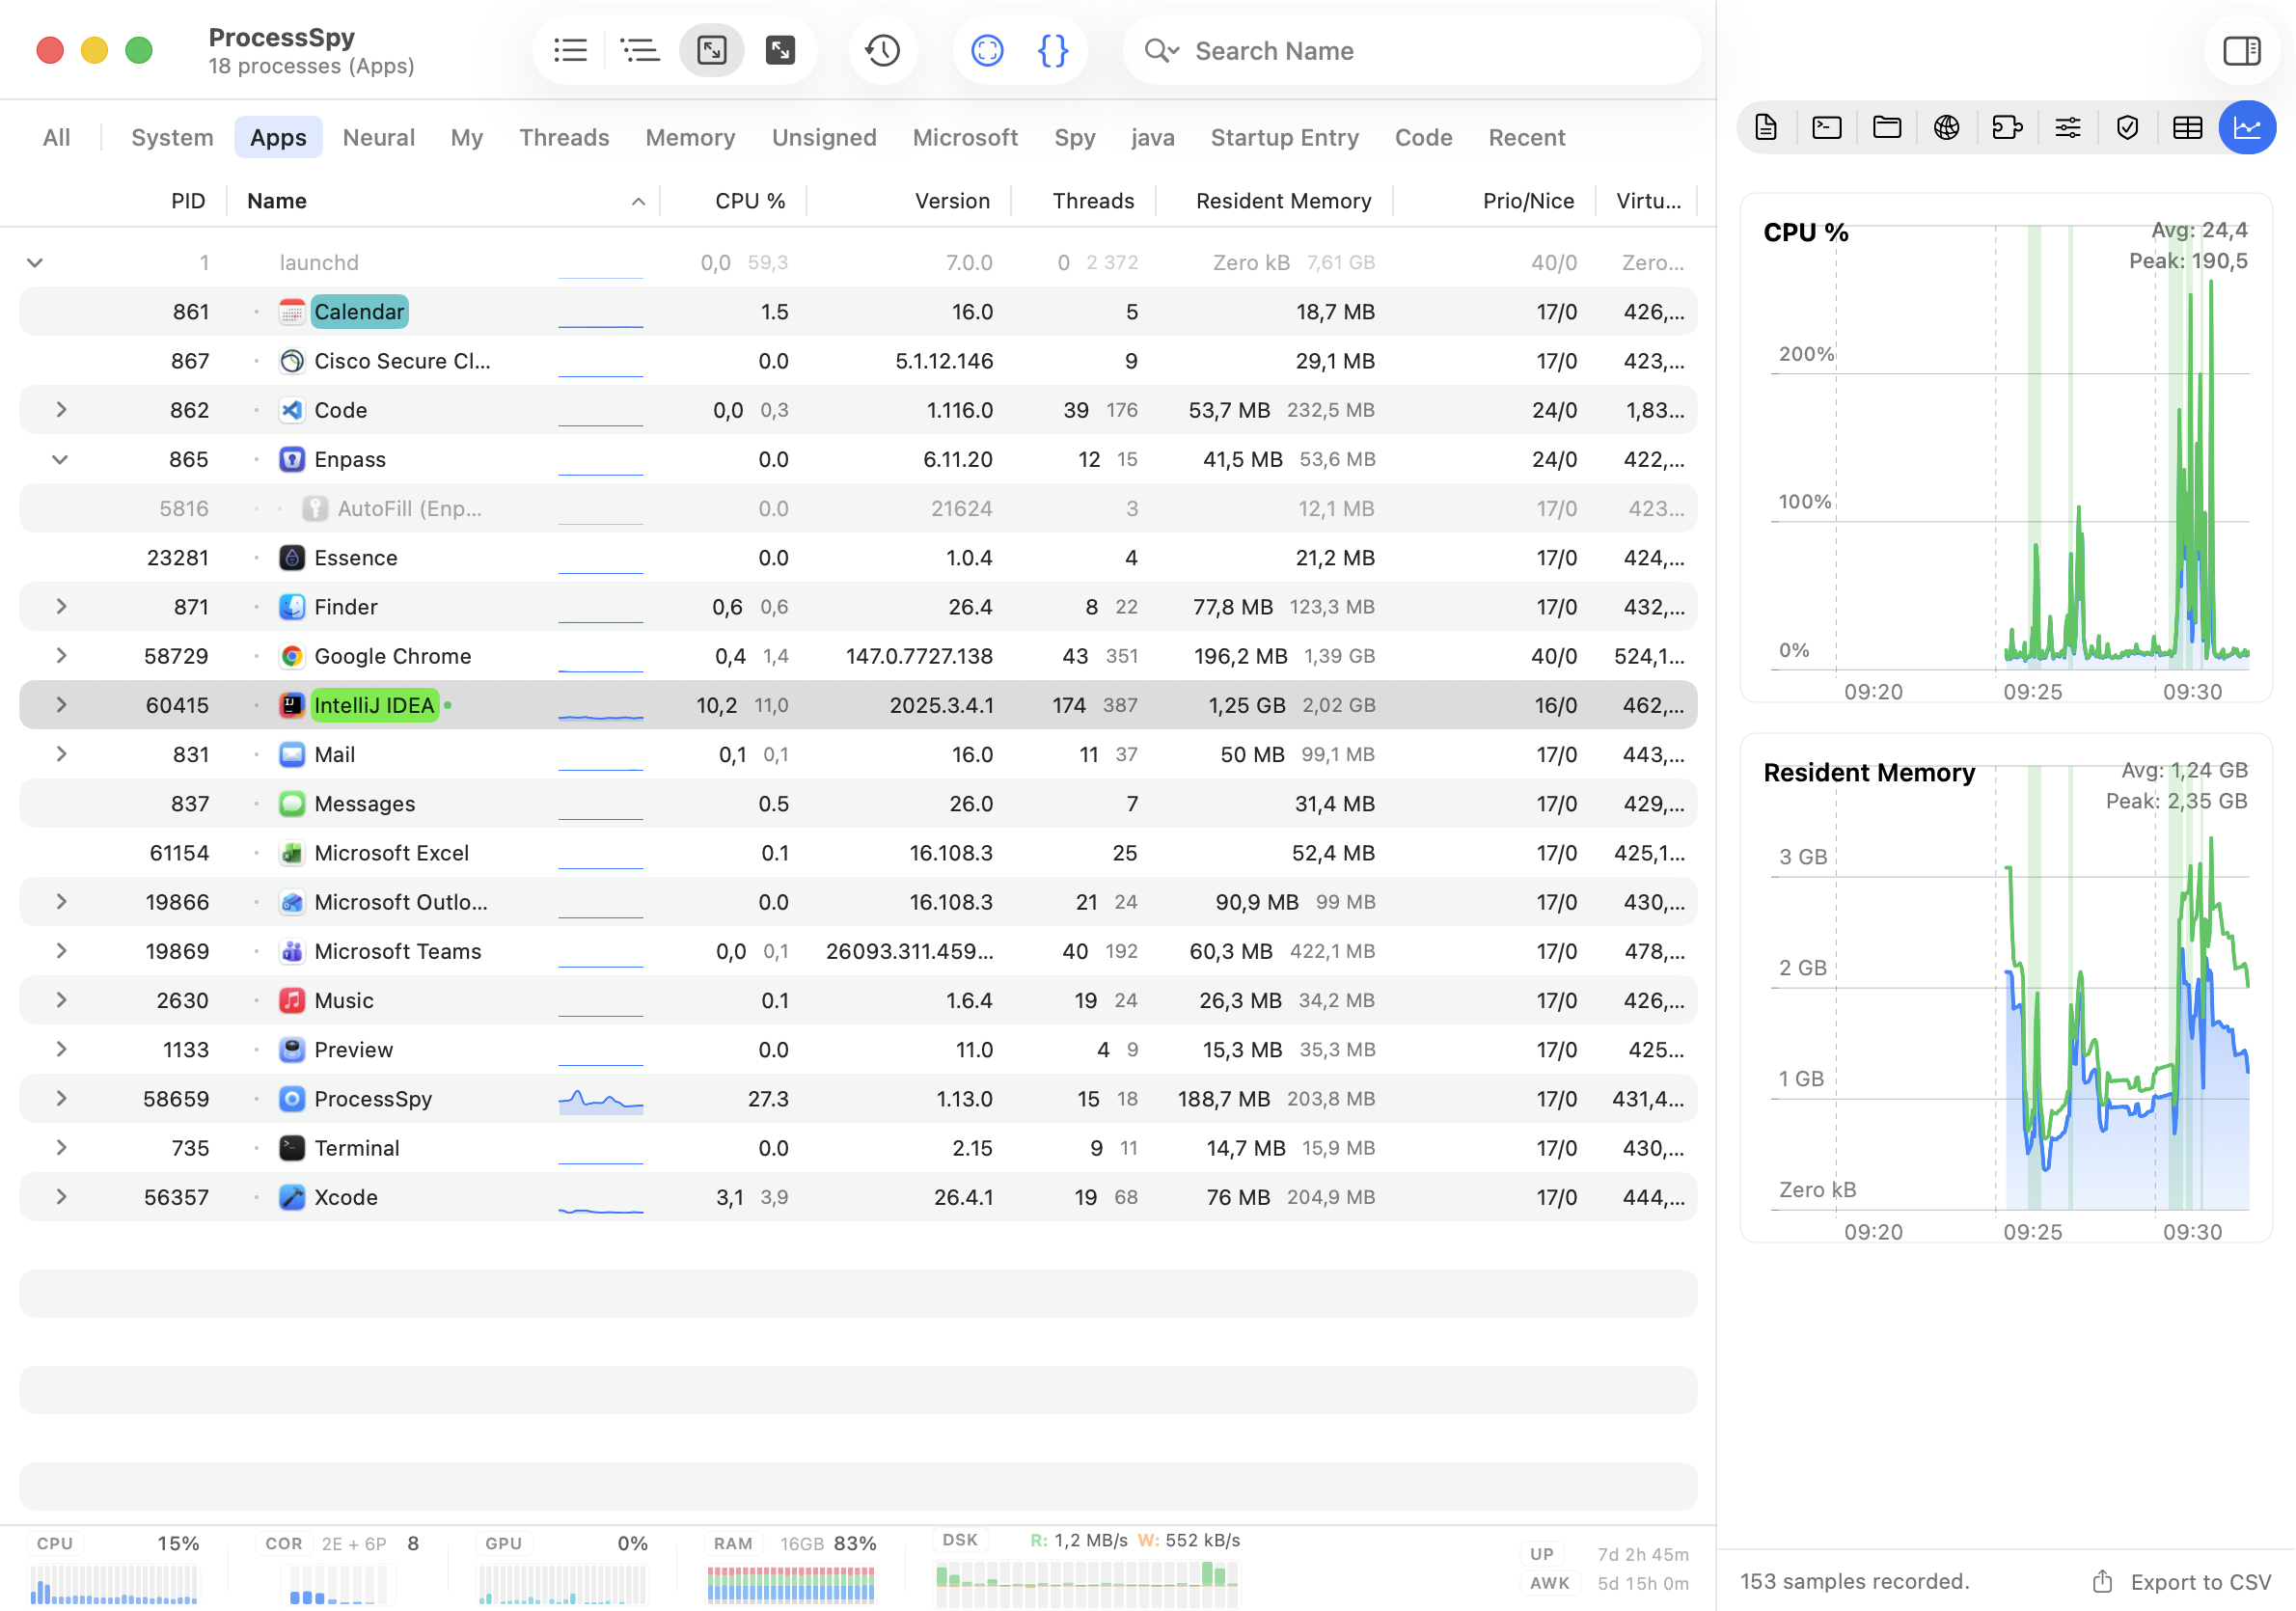
Track and Analyze Performance Over Time
Don't let transient performance spikes go unnoticed. ProcessSpy logs historical data for CPU, Memory, and Threads, mapping out aggregate values and application active states on detailed visual timelines. Easily pinpoint exactly when a resource spike occurred, view peak and average usage metrics, and export your findings directly to CSV for deeper analysis or reporting.
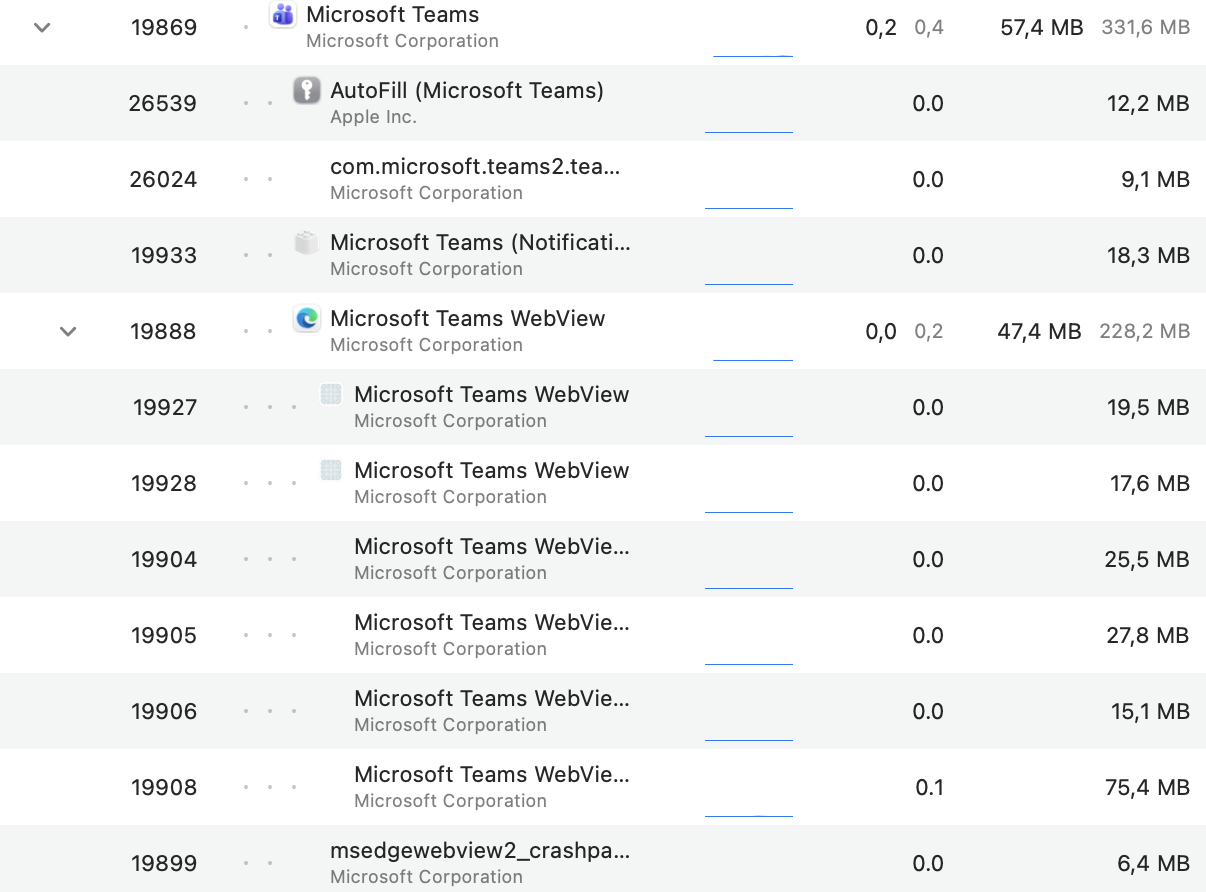
Unravel Complex App Hierarchies
Modern macOS apps often spawn countless helpers and background tasks. ProcessSpy's Advanced Tree View makes sense of the chaos by intuitively grouping child processes and automatically linking related XPC services based on their responsible PID. Instantly gauge the true system impact of an app with rolled-up aggregate totals for CPU, Memory, and Threads—all while retaining the full power of real-time search and custom JavaScript filtering.
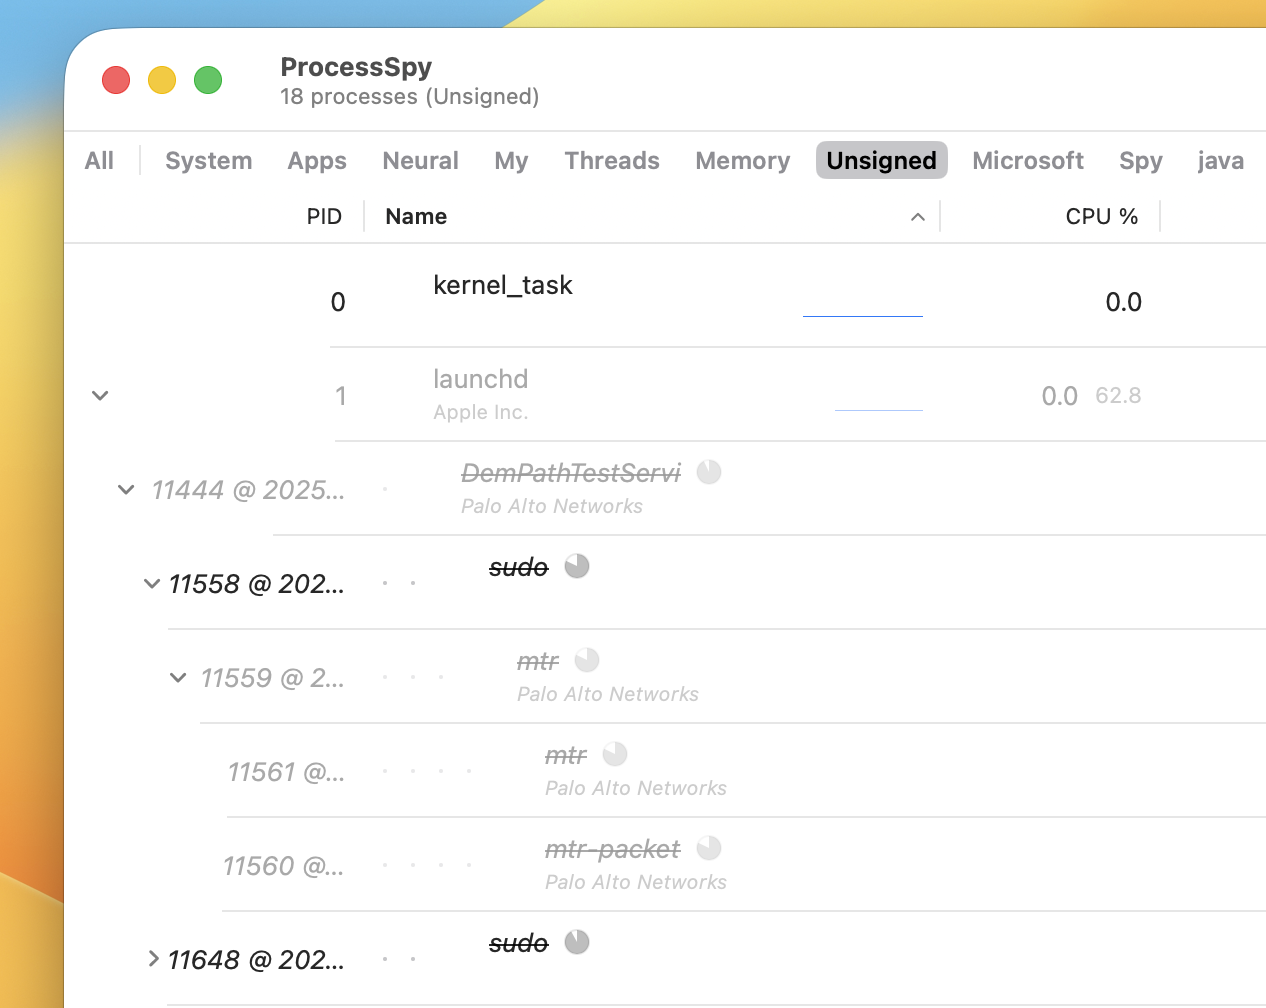
Remember finished processes
ProcessSpy remembers finished processes, their command line arguments, environment variables, history, and other details for later review. The tool also shows how much time is left until it forgets the process completely.
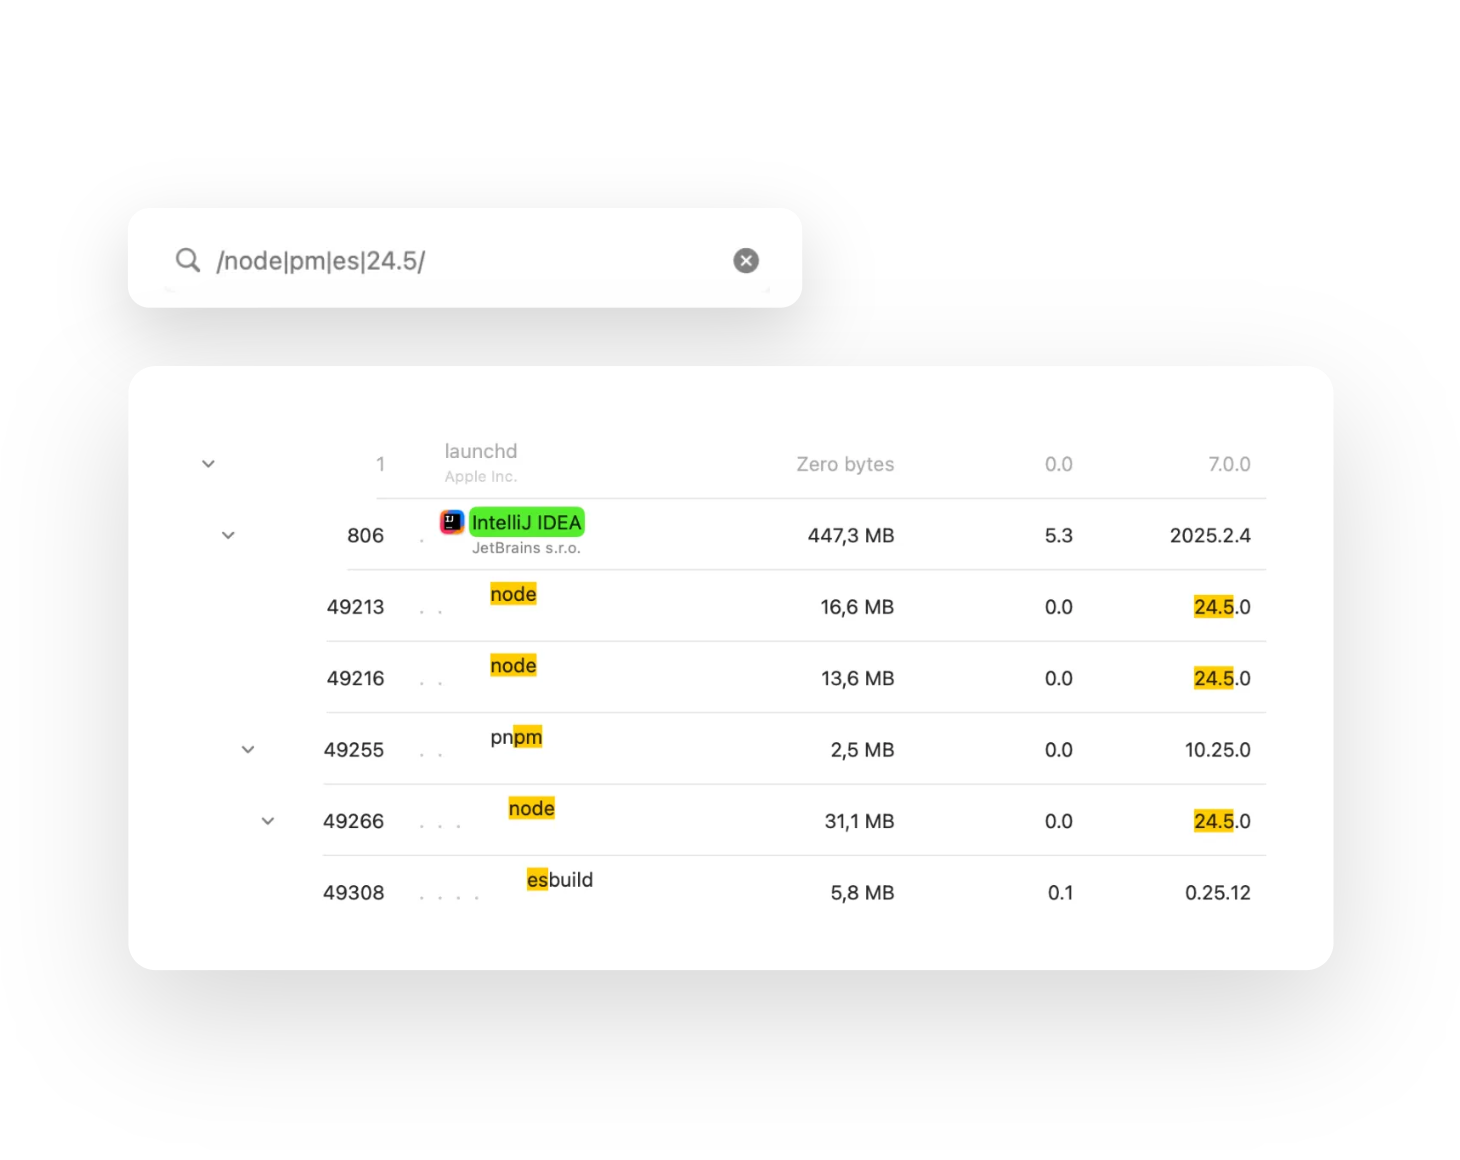
Multi-property and regex search
Quick-search in ProcessSpy supports regular expressions and multiple properties at once. For example, you can search for processes with "java" in the name and "-Xmx" in the command line. See docs for more info.
Why I Built ProcessSpy
I was juggling several Java apps, each using a different JDK version — and I couldn't tell which process was which in Activity Monitor.
All I saw was "java". No version, no path, no details.
So I built ProcessSpy — a developer-focused tool that shows full command-line info,
version details, environment variables, and more. I hope you will find it as useful as I do.
-Robert
How ProcessSpy Compares
| Feature | Activity Monitor | ProcessSpy |
|---|---|---|
| Resource insight | ||
| CPU QoS breakdown | ❌ | ✅ |
| Memory footprint with peak tracking | ❌ | ✅ |
| Disk I/O and memory pressure per second | ❌ | ✅ |
| Aggregate values in hierarchy mode | ❌ | ✅ CPU, Memory, Threads |
| Per-process mini CPU graph | ❌ | ✅ |
| Process identification | ||
| Distinguish between same-named processes | ❌ | ✅ Shows versions and paths |
| See full command-line & path | ❌ | ✅ |
| Start time and tagging new processes | ❌ | ✅ |
| Timeline visualization | ❌ | ✅ |
| Search & filtering | ||
| Multi-property and regex quick-search | ❌ | ✅ |
| Advanced filters (JS-based) | ❌ | ✅ |
| Workflow | ||
| Menu bar dashboard | ❌ | ✅ |
| Run Shortcuts on process events | ❌ | ✅ |
| History & analysis (paid) | ||
| CPU & Memory History | ❌ | ✅ |
| Remembers finished processes | ❌ | ✅ |
| History Export to CSV | ❌ | ✅ |
| Deep inspection (paid) | ||
| Environment variables | ❌ | ✅ |
| Entitlements, Info.plist, Bundle ID | ❌ | ✅ |
| Signature info | ❌ | ✅ |
| Startup entry (daemon, agent …) | ❌ | ✅ |
| Launched By (responsible PID) | ❌ | ✅ |
A license to unlock paid features can be purchased on Gumroad for $34.99 (lifetime updates, unlimited devices)
Frequently Asked Questions
Trusted by thousands of users.
Join developers, power users, and system administrators using ProcessSpy to monitor macOS processes with precision and clarity.
Prefer the Terminal?
Install ProcessSpy quickly via Homebrew:
brew install --cask processspy